Developing Intuition: “Statistically Significant” or “By Chance”?
Statistical tests are used to
determine how likely are observed relationships between two variables or groups NOT a result of some random guess, luck, erratic fluctuations, noise or
sampling error, but due to the fact that they really are related to one
another. It is a mathematical way of stating if we have enough evidence to
reject a ‘thought’(or in statistical jargon a ‘Hypothesis’) that a certain
relationship between two variables just happened by chance.
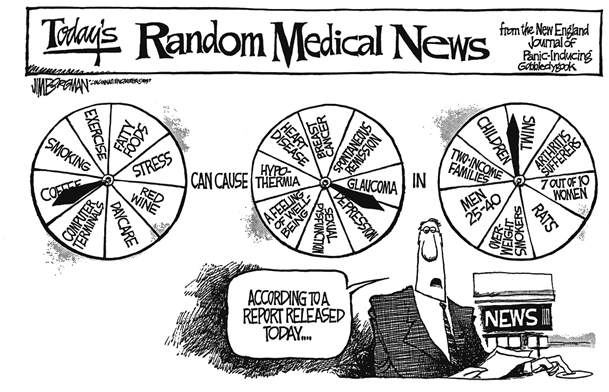 |
Figure Source: Agresti and Franklin, Statistics: The Art and Science of Learning from Data (p. 468)
|
Examples:
Student or Chimpanzee?
A student did exceptionally well in a test. His
Professor, however, is wondering if the student actually knew the material or
was it that random lucky guesses got him 100% in the test? Let us say if there
was only 1 question in the test and the student had to choose from only 2
possible outcomes, then getting the right answer could have been a result of
sheer luck. However, if there were 30 questions in the test and he did score a 100% score, it is quite unlikely to have been a result of random guesses. So the question is, how many questions does the
professor need to put in the test to negate the following null hypothesis:
Null Hypothesis, Ho : The student used random guessing to score 100% in
the test.

Who would do the Dishes?
Four siblings decide to take turns for washing dishes each
night. The older sibling suggests that they put their names in a jar and do a
lucky draw each night, to which all agree. Now, here is what happens: The older
sibling’s name does not show up for 4 nights in a row. The younger siblings
start getting suspicious, but he might have just gotten lucky. After how
many more nights will the younger siblings have enough evidence that there
might be something fishy going on, if the oldest sibling’s name never or rarely
shows up? 10 nights? 20 nights? 35 nights?
Null Hypothesis, Ho : The oldest sibling is manipulating the draw
 |
Some Statistical Jargon:
Null Hypothesis: The “thought” that we want to put to test. For
instance, a blogger wants to test his hypothesis that a “website template does
not have an impact on the number of readers it attracts”. Traditionally null
hypothesis is usually the thought we want to reject and here, it represents the
fact that the two variables, that is, “website template” and “number of
readers” are not related and do not impact one another.
Experiment: This is the project that we launch to test the null
hypothesis and to collect evidence against it. The blogger in previous example may go ahead
and design an experiment, where he changes his old template and checks the
number of additional clicks his website gets for a certain period of time.
P- Value:The probability of observing the difference, if in reality,
there is no difference is called a ‘p-value’.Suppose that a vaccine study
produced a P value of 0.04. This P value indicates that if the vaccine had no
effect on patients, you’d obtain the observed difference or more in 4% of
studies due to random sampling error. The p-value addresses only one question:
do we have sufficient evidence to reject the Null Hypothesis?If the p-value is
high, it does not mean that the Null hypothesis should be accepted. It simply
means that H0is not necessarily true but it is plausible,
and you may need more evidence before concluding anything. Here ‘more evidence’
often means a performing the experiment on a bigger sample size, or for more
extended period of time.
Significance Level, alpha: So, how small of a p-value is good
enough for us? Alpha is a threshold to determine just that and its value is
decided by the user. If p-value falls below alpha, we may reject the null
hypothesis. If the probability that an event occurs, is less than α, the usual
interpretation is that the event did not occur by chance. Formally, α is
the maximum acceptable level of risk for rejecting a true null hypothesis and
is expressed as a probability ranging between 0 and 1.

In our previous blogger’s
example,let us assume that the blogger ran the experiment for one day and
noticed 6 additional clicks at the top of the usual 100 clicks that his blog
usually gets. For now, let us also assume that the computed P-value turned out
to be 0.06 (we will see how to compute p-values, later in this series). Owing to the nature of the experiment, we can
set alpha to 0.05 (which means we are assuming 5% of the sample size will show
a difference, owing to ‘chance’). We will reject the null hypothesis only if
p-value falls below 0.05. So should he conclude that 6 additional clicks mean
that the website template did indeed matter? Since p-value > alpha, we
cannot reject the null hypothesis. And this makes sense! As mentioned earlier,
a p-value of 0.06 means that 6% of the blogger’s sample size is likely to show
a difference owing to random sampling error. Thus those additional 6 clicks may
havebeen entirely due to a few wandering web surfers who happened to land to
his website, totally oblivious of the change in website template.But it is also
likely, that these were genuine readers who were impacted by the template. We
therefore, would conclude that we do not have enough evidence to reject the
null hypothesis and draw conclusions.We either need a lot of difference (6% is
not enough) or a larger sample size.
To collect more evidence, let us
say that the blogger then went ahead and conducted the experiment for 1 year
and got additional clicks of 100K over his usual clicks of 200K per year. Let
us assume that the p-value in this case turns out to be 0.0001. Since p-values
<alpha, we will conclude that we have enough evidence that the change in
template does indeed cause a difference.
The Choice of Significance Level?
Choose a larger alpha, such as
0.50, to be more certain that you will not miss detecting a difference that
might exist. For instance, for the blogger in the previous example, a higher
significance level should be sufficient. For a pharmaceutical company,however,
which wants to be very certain before making an advertising claim that its new
product significantly reduces symptoms, we may choose an α of 0.001 to be sure
that any significant difference in symptoms that they detect actually does
exist.
Confidence Interval, CI:
We usually cannot take the entire
population into account while performing statistical test. For instance, if you
want to check if a medicine works, we will take a sample of population (say 1000
people) to test its effect, and try to generalize the results for a larger
population (say the whole population of USA).
Let us say the medicine aids
children to grow. In the diagram underneath, each vertical blue line represents
the range of values for the increase in heights among children found in 20
states. The horizontal black line is the mean increase in height. The vertical
red line indicates that a certain state’s confidence interval does not include
the mean. Thus 19 out of 20 confidence intervals (blue lines) or 95% of the
samples contain the mean of the population.
We are thus 95% sure that the given mean holds true for the whole
population.
 |
Illustration idea from Minitab- What is
Confidence Interval?
|
Use the confidence interval to
assess the estimate of the population parameter. For example, a manufacturer
wants to know if the mean length of the pencils they produce is different than
the target length. The manufacturer takes a random sample of pencils and
determines that the mean length of the sample is 52 millimeters and the 95%
confidence interval is (50,54). Therefore, they can be 95% confident that the
mean length of all pencils is between 50 and 54 millimeters
Some Rules to Keep in
Mind:
- If the P value is less than your significance (alpha) level, the hypothesis test is statistically significant.
- If the confidence interval does not contain the null hypothesis value, the results are statistically significant.
- If the P value is less than alpha, the confidence interval will not contain the null hypothesis value
References:
http://blog.minitab.com/blog/adventures-in-statistics/understanding-hypothesis-tests%3A-confidence-intervals-and-confidence-levels
 If you enjoyed this post and wish to be informed whenever a new post is published, then make sure you subscribe to my regular Email Updates.
Subscribe Now!
If you enjoyed this post and wish to be informed whenever a new post is published, then make sure you subscribe to my regular Email Updates.
Subscribe Now!


0 comments:
Leave your feed back here.